A Labor Day Look at How American Workers Have Changed over 40 Years

A Labor Day Look at How American Workers Have Changed over 40 Years
Happy Labor Day! The U.S. workforce has been changing over many generations. It’s been changing with respect to the work people do. For example, an increasing share of workers is engaged in service or technology work, while a decreasing share is engaged in factory or farm work. The focus of this article, however, is on the personal characteristics of the people who do the work. Specifically, it looks at how the percentage of employed people by age has changed from 1979 to 2019.
To learn more about workers, rather than about just their jobs, we can’t ask their employers. We need to ask workers themselves. BLS partners with the U.S. Census Bureau each month to survey some 60,000 U.S. households about their work and other topics (Current Survey Population- CPS). We can learn at least three important things by surveying workers that we can’t learn by surveying employers. First, we can learn about things like self-employment, multiple jobholding, and “alternative” work arrangements, like so- called “gig” work. Second, we can learn about people who are not currently employed. In fact, BLS uses these data each month to measure how many are “unemployed,” roughly meaning they are actively looking for a job and available to start. Third, and most relevant here, we can learn about people’s personal characteristics—things like their age, race, and marital status, which their employers might not know or might find hard to detail in a BLS survey.
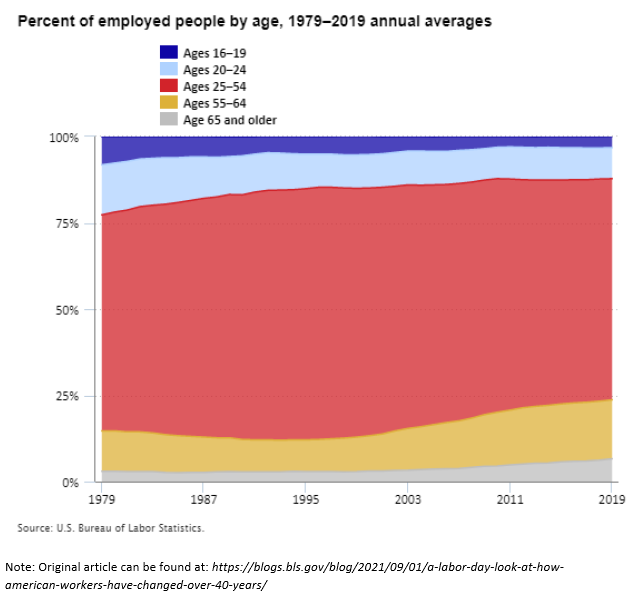
Based on these data, in 1979, 8 percent of U.S. workers were ages 16 to 19. By 2019, just 3 percent were. Over the same 40-year period, the share that were ages 16 to 24 fell from 23 percent to 12 percent (see graph below). Two things happened. First, the age composition of the entire population shifted. In 1979, the tail end of the large, post-World War II “baby boom” generation was about 16 years old. The generation that came after this group was smaller, so its share of the workforce was smaller too. Second, young people’s “participation rate”—the share that were working or seeking work—declined. In fact, that rate peaked at 58 percent in 1979, then fell to 34 percent by 2011. This huge change coincided with increases in school enrollment and educational attainment. This example illustrates how two forces combine to reshape the face of American labor: the shifting composition of the working age population, and shifts in participation rates of different groups.
The American workforce has aged. Between 1979 and 2019, the fraction of the employed population that is 65 years old or older grew from 3 percent to 7 percent. The share that is 55 or older grew from 15 percent to 24 percent. Forces behind this trend include the aging of baby boomers (they are mostly 60 or older today), medical and other advances that have ex- tended lives and health, and less physically strenuous jobs. The participation rate story is a little more complicated: As a group, today’s older women always were more likely to work for pay than their mothers or grandmothers were. Participation among older men, in contrast, first ebbed and then rebounded across these 40 years.
Tags: